| tank | mean | median | max | sd |
|---|---|---|---|---|
| Tank 1 | -194.7 | -194.8 | -190.5 | 0.5 |
| Tank 2 | -195.1 | -195.1 | -189.7 | 0.3 |
| Tank 3 | -195.4 | -195.4 | -191.7 | 0.3 |
ICMP culture collection nitrogen stats
Statistical analysis of Chart MVE nitrogen storage tanks
Introduction
The ICMP culture collection of New Zealand has over 23,000 cryopreserved cultures. In late March 2022 the existing 13 liquid nitrogen dewars were replaced with three Chart MVE HEco 1500-190 (1542R-190AF-BB-TS) storage tanks. This system has the ability to record statistics on temperature and liquid nitrogen use. Presented here is an analysis of some of these statistics.
Tank 1 is the ‘stock’, Tank 3 is ‘user’, and Tank 2 is currently mostly empty. The 1542R-190 has an inner diameter of 978 mm and a usable internal height of 782 mm, thus can contain 768 litres of liquid nitrogen. However all our samples (in ranks) are stored in the gas phase of nitrogen, thus the liquid nitrogen portion of the tanks is 115 L under the tray on top of which the racks sit.
Temperatures
Temperature is measured at the bottom and top of each tank. The bottom temperature probe is constantly submerged in liquid nitrogen.
Liquid nitrogen is -195.8°C at STP, the temperature at the bottom of the tanks is stable and near this temperature. The following tables aggregate statistics on 7213 data points for each tank since April 2022.
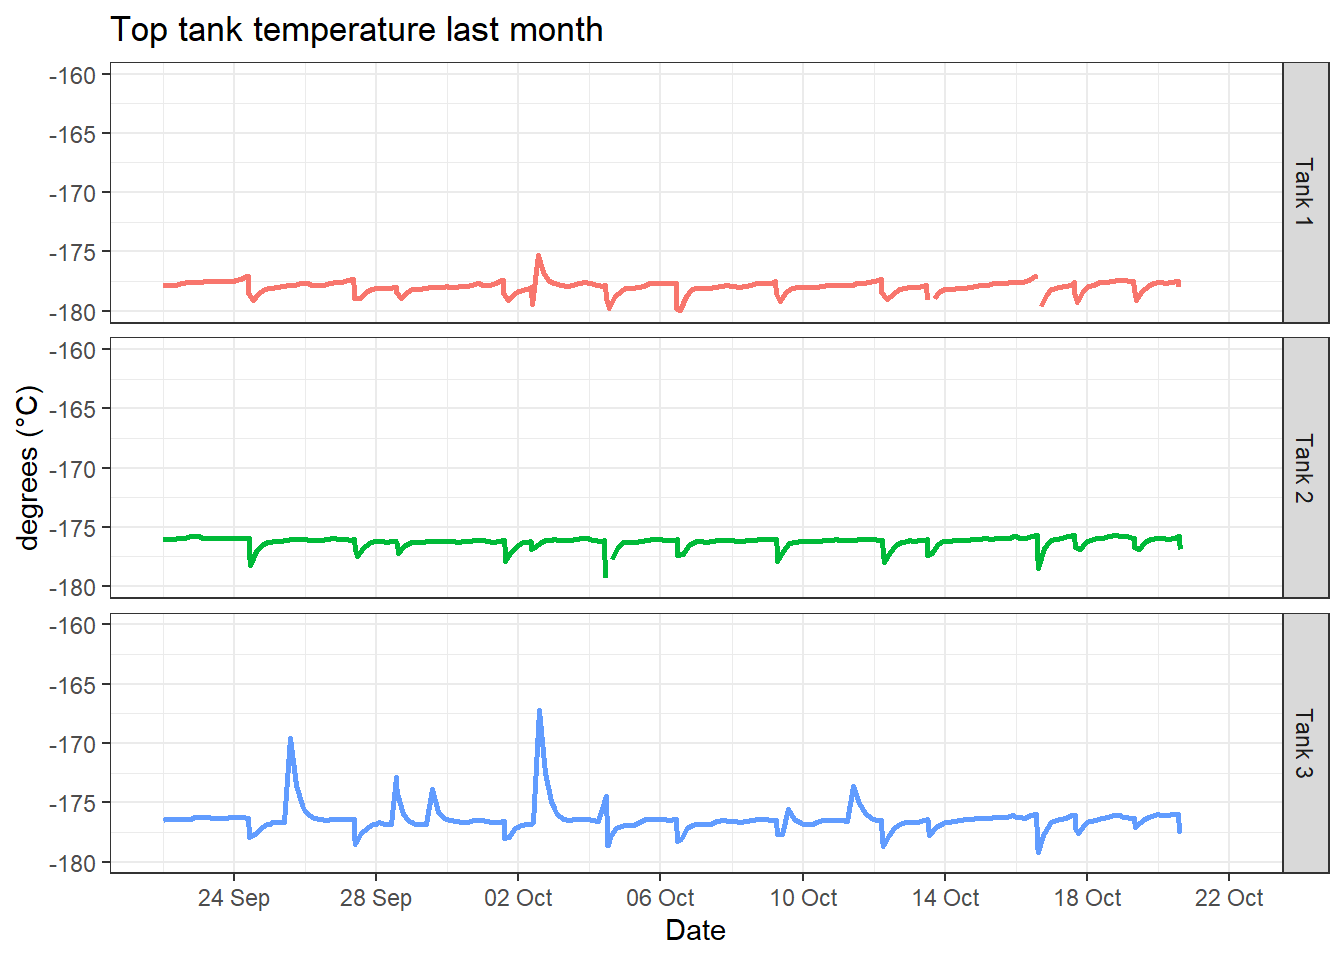
Top tank temperatures
The temperature at the top of the tank is warmer, and more variable due to warming when retrieving samples.
| tank | mean | median | max | sd |
|---|---|---|---|---|
| Tank 1 | -177.8 | -177.7 | -163.3 | 0.7 |
| Tank 2 | -176.3 | -176.2 | -151.9 | 0.9 |
| Tank 3 | -176.6 | -176.7 | -159.3 | 1.4 |
Big spikes in temperature can be seen in May to June when the tanks were first loaded with samples. Tank 3 is our most often accessed tank, so has temperature spikes as samples are accessed. Some temperature spiking is normal, but it should not exceed the glass transition temperature of about -130°C.
Warning: Removed 1 row containing missing values or values outside the scale range
(`geom_line()`).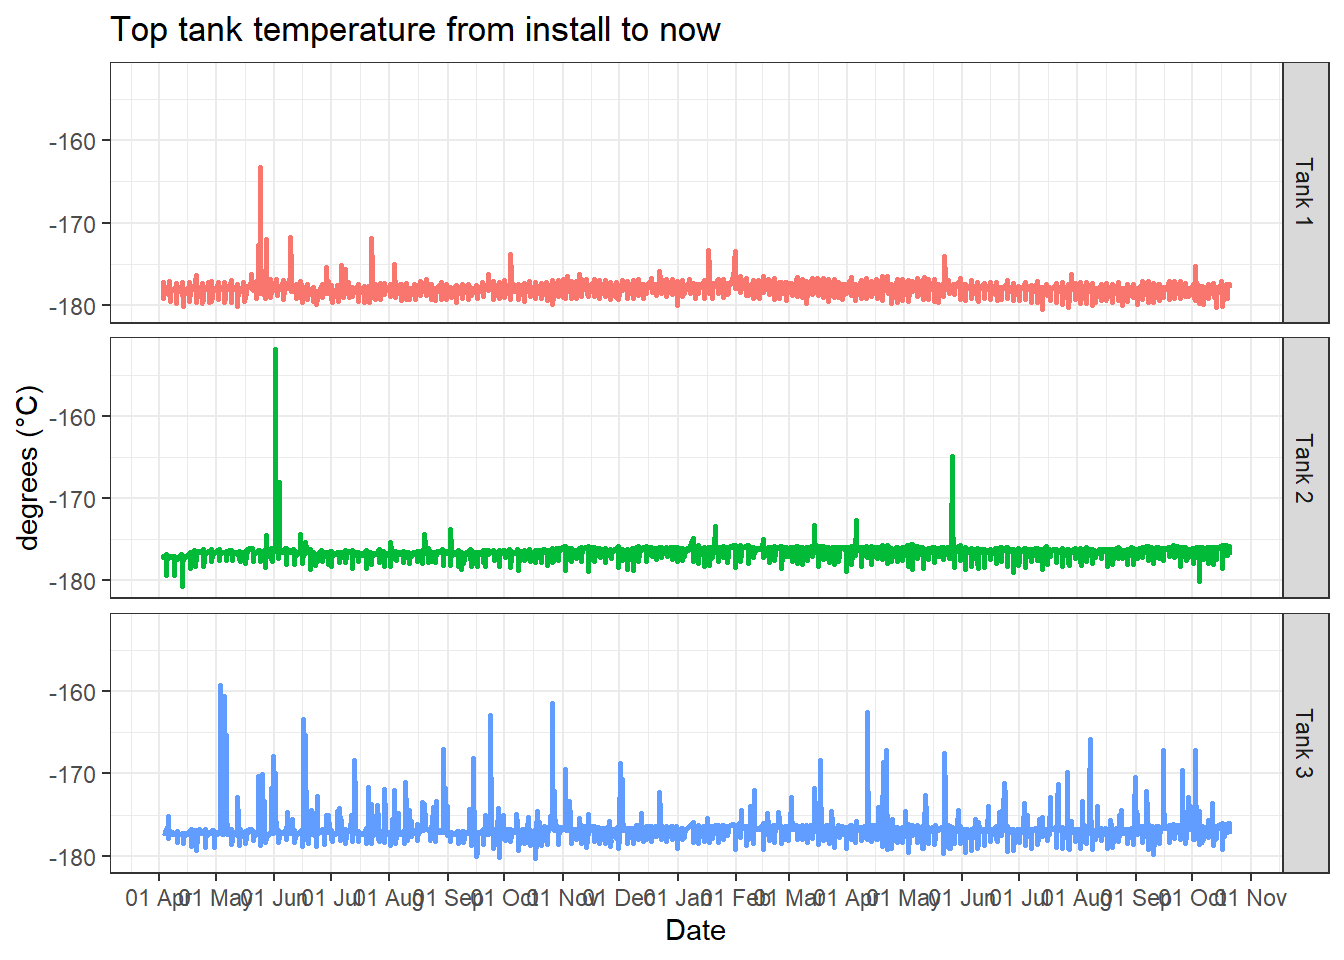
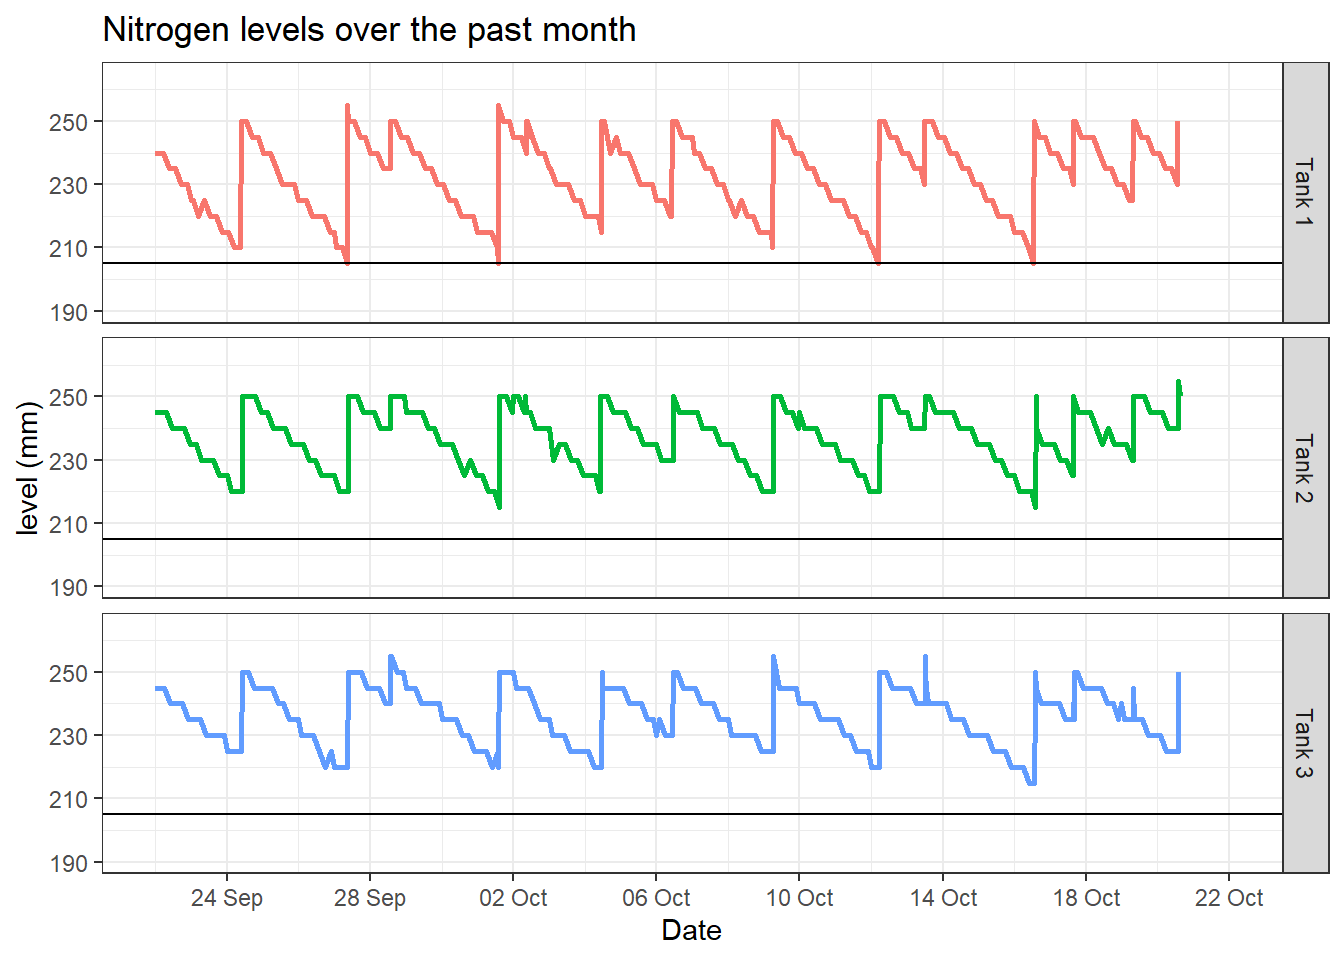
Nitrogen levels
The level of liquid nitrogen in the tanks changes as it evaporates away and is refilled. The minimum level triggering a fill is 205 mm, tanks get filled to 250 mm. On 20th September 2022 the manifold was commissioned allowing “one-fill all-fill” (OFAF) to work. OFAF fills all tanks sequentially once any one triggers the process.
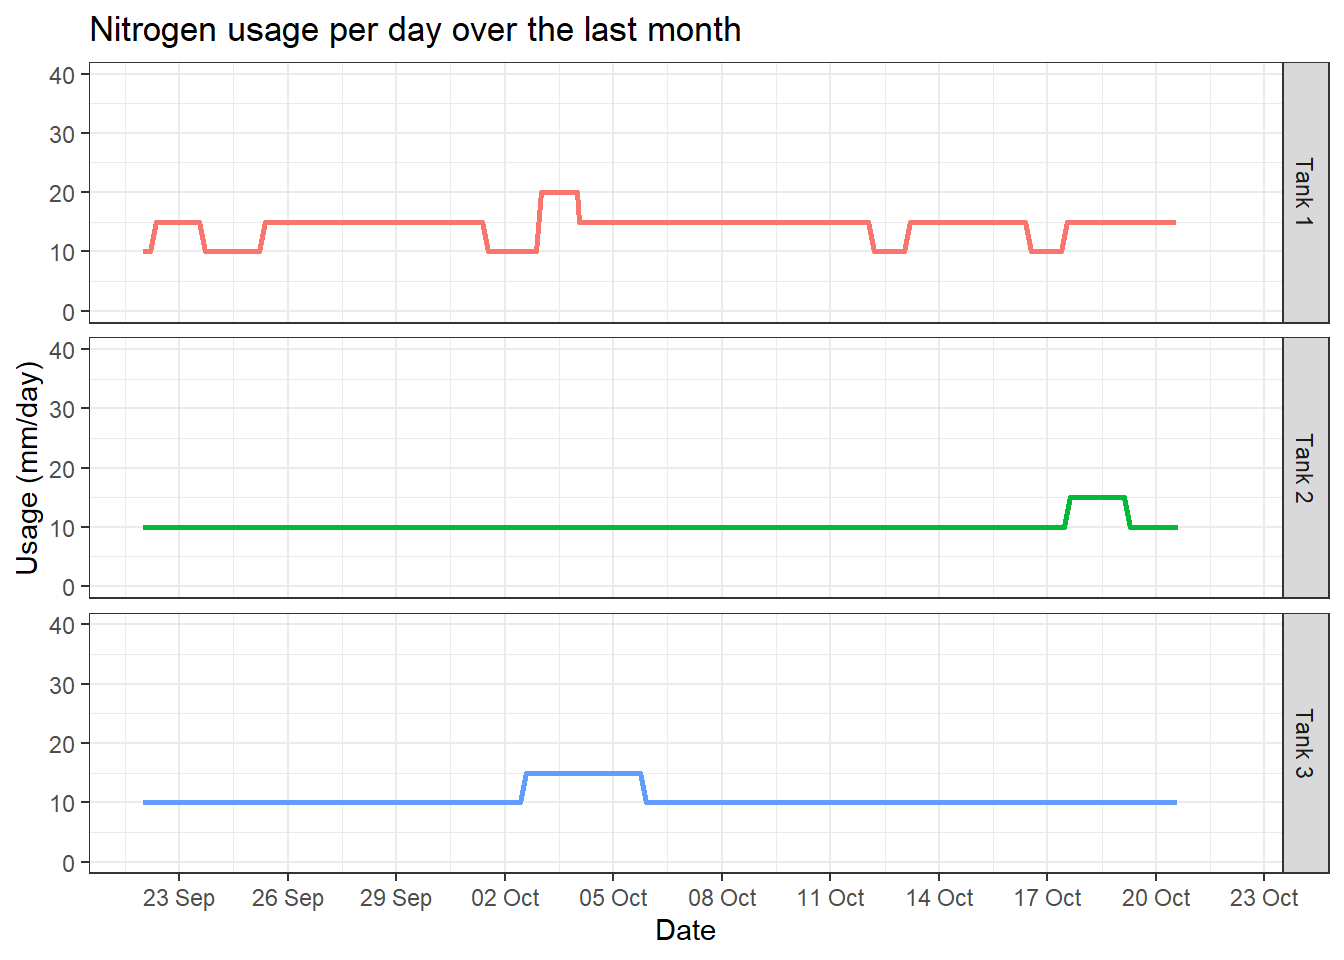
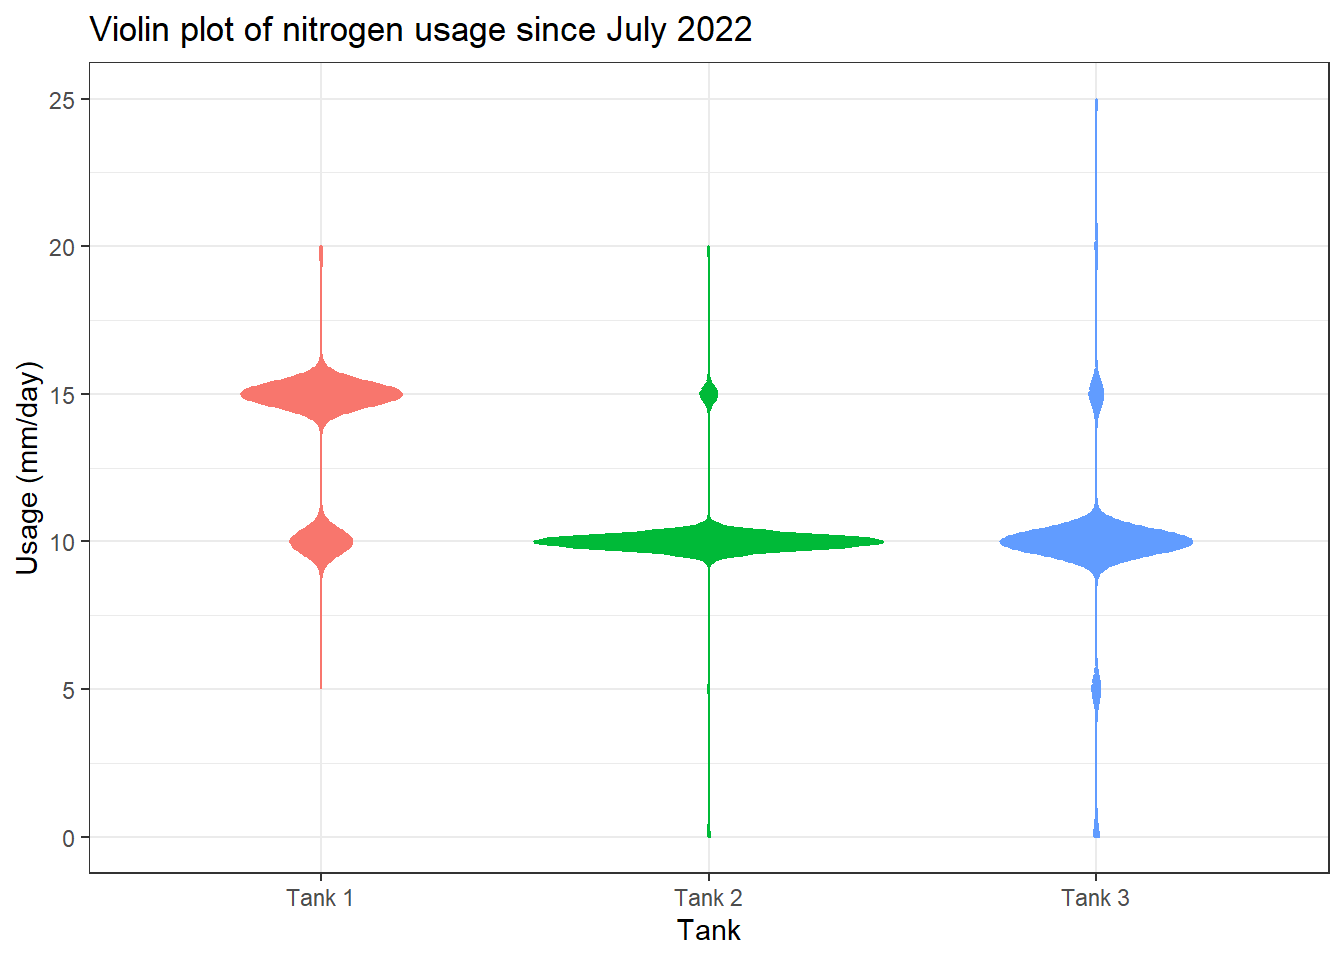
Nitrogen usage
Nitrogen usage as reported by the system in mm per day. 10 mm depth in the tank is about 7.5 litres, 15 mm is 11.2 litres.
Last fills
This is a list of the last five fills for each tank
| tank | date_time | temp_top | temp_bottom | level | usage | status |
|---|---|---|---|---|---|---|
| Tank 1 | 2024-07-29 16:06:00 | -176.8 | -193.8 | 205 | 15 | F |
| Tank 1 | 2024-07-26 07:59:00 | -177.0 | -193.8 | 210 | 10 | F |
| Tank 1 | 2024-07-23 01:00:00 | -176.9 | -194.3 | 215 | 10 | F |
| Tank 1 | 2024-07-23 00:54:00 | -176.8 | -193.8 | 205 | 10 | F |
| Tank 1 | 2024-07-19 14:58:00 | -177.6 | -195.0 | 235 | 15 | F |
| tank | date_time | temp_top | temp_bottom | level | usage | status |
|---|---|---|---|---|---|---|
| Tank 2 | 2024-07-29 17:00:00 | -175.6 | -194.8 | 210 | 15 | F |
| Tank 2 | 2024-07-26 08:52:00 | -175.8 | -194.7 | 215 | 10 | F |
| Tank 2 | 2024-07-23 01:43:00 | -175.7 | -194.9 | 215 | 10 | F |
| Tank 2 | 2024-07-19 15:32:00 | -175.8 | -195.2 | 240 | 10 | F |
| Tank 2 | 2024-07-18 07:00:00 | -176.1 | -194.9 | 225 | 10 | F |
| tank | date_time | temp_top | temp_bottom | level | usage | status |
|---|---|---|---|---|---|---|
| Tank 3 | 2024-07-29 16:38:00 | -176.2 | -195.4 | 220 | 10 | F |
| Tank 3 | 2024-07-26 08:31:00 | -176.4 | -195.3 | 215 | 10 | F |
| Tank 3 | 2024-07-23 01:23:00 | -176.0 | -195.3 | 220 | 10 | F |
| Tank 3 | 2024-07-19 15:16:00 | -176.4 | -195.7 | 235 | 10 | F |
| Tank 3 | 2024-07-18 06:36:00 | -176.5 | -195.4 | 220 | 10 | F |
Status messages
The tables below list the last 30 status messages for each tank, removing the very common hot gas bypass and level zeroing codes. A list of the meaning of all event log codes is at the bottom of the page. The most recent event is first.
| tank | date_time | temp_top | temp_bottom | level | usage | status |
|---|---|---|---|---|---|---|
| Tank 1 | 2024-07-29 16:06:00 | -176.8 | -193.8 | 205 | 15 | F |
| Tank 1 | 2024-07-26 07:59:00 | -177.0 | -193.8 | 210 | 10 | F |
| Tank 1 | 2024-07-23 01:00:00 | -176.9 | -194.3 | 215 | 10 | F |
| Tank 1 | 2024-07-23 00:54:00 | -176.8 | -193.8 | 205 | 10 | F |
| Tank 1 | 2024-07-19 14:58:00 | -177.6 | -195.0 | 235 | 15 | F |
| Tank 1 | 2024-07-18 06:08:00 | -177.0 | -193.9 | 205 | 10 | F |
| Tank 1 | 2024-07-14 22:06:00 | -177.7 | -194.6 | 220 | 15 | F |
| Tank 1 | 2024-07-12 10:18:00 | -177.9 | -194.7 | 230 | 15 | F |
| Tank 1 | 2024-07-10 13:00:00 | -177.2 | -194.3 | 220 | 10 | F |
| Tank 1 | 2024-07-10 12:50:00 | -176.9 | -193.7 | 205 | 10 | F |
| Tank 1 | 2024-07-07 06:04:00 | -176.7 | -193.7 | 205 | 10 | F |
| Tank 1 | 2024-07-03 21:53:00 | -176.8 | -193.7 | 205 | 10 | F |
| Tank 1 | 2024-06-30 13:00:00 | -177.7 | -194.8 | 240 | 15 | F |
| Tank 1 | 2024-06-30 12:42:00 | -176.9 | -193.7 | 205 | 15 | F |
| Tank 1 | 2024-06-27 05:00:00 | -176.7 | -193.7 | 220 | 10 | F |
| Tank 1 | 2024-06-27 04:59:00 | -176.7 | -193.7 | 205 | 10 | F |
| Tank 1 | 2024-06-23 21:45:00 | -176.7 | -193.7 | 205 | 10 | F |
| Tank 1 | 2024-06-20 13:52:00 | -176.7 | -193.7 | 205 | 10 | F |
| Tank 1 | 2024-06-17 06:35:00 | -177.5 | -195.0 | 230 | 15 | F |
| Tank 1 | 2024-06-15 14:13:00 | -176.7 | -193.8 | 205 | 10 | F |
| Tank 1 | 2024-06-14 09:12:00 | -180.6 | -195.3 | 225 | 15 | AM |
| Tank 1 | 2024-06-14 09:00:00 | -180.6 | -195.4 | 225 | 15 | FD AM |
| Tank 1 | 2024-06-14 08:42:00 | -180.3 | -195.5 | 220 | 15 | FD AM |
| Tank 1 | 2024-06-14 08:42:00 | -180.3 | -195.5 | 225 | 15 | FD |
| Tank 1 | 2024-06-14 08:41:00 | -180.2 | -195.4 | 225 | 15 | FT |
| Tank 1 | 2024-06-14 08:02:00 | -177.4 | -194.6 | 220 | 15 | F |
| Tank 1 | 2024-06-11 21:00:00 | -177.9 | -194.9 | 235 | 15 | F |
| Tank 1 | 2024-06-11 20:41:00 | -176.9 | -193.8 | 210 | 15 | F |
| Tank 1 | 2024-06-09 03:52:00 | -176.9 | -193.9 | 205 | 10 | F |
| Tank 1 | 2024-06-06 05:12:00 | -177.0 | -193.9 | 205 | 15 | F |
| tank | date_time | temp_top | temp_bottom | level | usage | status |
|---|---|---|---|---|---|---|
| Tank 2 | 2024-07-29 17:43:00 | -178.0 | -195.2 | 210 | 15 | AM |
| Tank 2 | 2024-07-29 17:40:00 | -177.9 | -195.1 | 210 | 15 | FT |
| Tank 2 | 2024-07-29 17:40:00 | -177.9 | -195.1 | 210 | 15 | F FT |
| Tank 2 | 2024-07-29 17:00:00 | -175.6 | -194.8 | 210 | 15 | F |
| Tank 2 | 2024-07-26 08:52:00 | -175.8 | -194.7 | 215 | 10 | F |
| Tank 2 | 2024-07-23 01:43:00 | -175.7 | -194.9 | 215 | 10 | F |
| Tank 2 | 2024-07-19 15:32:00 | -175.8 | -195.2 | 240 | 10 | F |
| Tank 2 | 2024-07-18 07:00:00 | -176.1 | -194.9 | 225 | 10 | F |
| Tank 2 | 2024-07-18 06:54:00 | -175.9 | -194.9 | 215 | 10 | F |
| Tank 2 | 2024-07-14 21:45:00 | -176.1 | -195.0 | 220 | 10 | F |
| Tank 2 | 2024-07-12 10:34:00 | -176.2 | -195.0 | 230 | 10 | F |
| Tank 2 | 2024-07-10 13:43:00 | -175.7 | -194.6 | 215 | 10 | F |
| Tank 2 | 2024-07-07 07:00:00 | -175.7 | -194.8 | 220 | 10 | F |
| Tank 2 | 2024-07-07 06:56:00 | -175.6 | -194.8 | 215 | 10 | F |
| Tank 2 | 2024-07-03 23:00:00 | -176.3 | -195.0 | 230 | 10 | F |
| Tank 2 | 2024-07-03 22:46:00 | -175.7 | -194.7 | 215 | 10 | F |
| Tank 2 | 2024-06-30 13:31:00 | -175.7 | -194.7 | 215 | 10 | F |
| Tank 2 | 2024-06-27 05:48:00 | -175.7 | -194.8 | 215 | 10 | F |
| Tank 2 | 2024-06-23 23:00:00 | -176.9 | -195.3 | 250 | 10 | F |
| Tank 2 | 2024-06-23 22:38:00 | -175.6 | -194.8 | 215 | 10 | F |
| Tank 2 | 2024-06-20 14:39:00 | -175.7 | -194.8 | 215 | 10 | F |
| Tank 2 | 2024-06-17 07:02:00 | -175.8 | -195.2 | 235 | 10 | F |
| Tank 2 | 2024-06-15 15:00:00 | -175.5 | -194.5 | 210 | 10 | F |
| Tank 2 | 2024-06-15 14:59:00 | -175.5 | -194.5 | 210 | 10 | F |
| Tank 2 | 2024-06-14 08:38:00 | -175.8 | -195.1 | 220 | 10 | FD |
| Tank 2 | 2024-06-11 21:32:00 | -175.8 | -194.9 | 220 | 10 | F |
| Tank 2 | 2024-06-09 04:39:00 | -175.6 | -194.8 | 220 | 10 | F |
| Tank 2 | 2024-06-06 06:09:00 | -175.7 | -194.8 | 220 | 10 | F |
| Tank 2 | 2024-06-03 08:36:00 | -175.6 | -194.8 | 215 | 10 | F |
| Tank 2 | 2024-05-31 10:26:00 | -175.8 | -194.9 | 225 | 10 | F |
| tank | date_time | temp_top | temp_bottom | level | usage | status |
|---|---|---|---|---|---|---|
| Tank 3 | 2024-07-29 16:38:00 | -176.2 | -195.4 | 220 | 10 | F |
| Tank 3 | 2024-07-26 08:31:00 | -176.4 | -195.3 | 215 | 10 | F |
| Tank 3 | 2024-07-23 01:23:00 | -176.0 | -195.3 | 220 | 10 | F |
| Tank 3 | 2024-07-19 15:16:00 | -176.4 | -195.7 | 235 | 10 | F |
| Tank 3 | 2024-07-18 06:36:00 | -176.5 | -195.4 | 220 | 10 | F |
| Tank 3 | 2024-07-14 21:21:00 | -176.4 | -195.2 | 205 | 10 | F |
| Tank 3 | 2024-07-12 10:41:00 | -176.8 | -195.4 | 230 | 10 | F |
| Tank 3 | 2024-07-10 13:22:00 | -173.0 | -194.7 | 220 | 10 | F |
| Tank 3 | 2024-07-07 06:35:00 | -176.2 | -195.3 | 220 | 10 | F |
| Tank 3 | 2024-07-03 22:22:00 | -176.4 | -195.3 | 220 | 10 | F |
| Tank 3 | 2024-06-30 13:10:00 | -176.4 | -195.3 | 220 | 10 | F |
| Tank 3 | 2024-06-27 05:30:00 | -176.4 | -195.4 | 220 | 10 | F |
| Tank 3 | 2024-06-23 22:14:00 | -176.1 | -195.3 | 215 | 10 | F |
| Tank 3 | 2024-06-20 14:21:00 | -176.4 | -195.4 | 220 | 10 | F |
| Tank 3 | 2024-06-17 06:54:00 | -176.5 | -195.7 | 235 | 10 | F |
| Tank 3 | 2024-06-15 14:40:00 | -176.3 | -195.4 | 210 | 10 | F |
| Tank 3 | 2024-06-14 08:46:00 | -176.4 | -195.6 | 230 | 10 | FD |
| Tank 3 | 2024-06-11 21:12:00 | -176.5 | -195.4 | 215 | 10 | F |
| Tank 3 | 2024-06-09 04:20:00 | -176.0 | -195.3 | 220 | 15 | F |
| Tank 3 | 2024-06-06 06:00:00 | -177.0 | -195.6 | 235 | 10 | F |
| Tank 3 | 2024-06-06 05:41:00 | -176.1 | -195.3 | 220 | 10 | F |
| Tank 3 | 2024-06-03 08:21:00 | -176.3 | -195.3 | 225 | 10 | F |
| Tank 3 | 2024-05-31 10:08:00 | -176.5 | -195.4 | 230 | 10 | F |
| Tank 3 | 2024-05-29 00:53:00 | -176.5 | -195.4 | 225 | 10 | F |
| Tank 3 | 2024-05-26 03:03:00 | -176.2 | -195.4 | 220 | 10 | F |
| Tank 3 | 2024-05-23 03:51:00 | -176.3 | -195.5 | 225 | 10 | F |
| Tank 3 | 2024-05-20 06:06:00 | -176.2 | -195.3 | 215 | 10 | F |
| Tank 3 | 2024-05-17 12:11:00 | -176.5 | -195.7 | 240 | 10 | F |
| Tank 3 | 2024-05-16 07:37:00 | -176.2 | -195.4 | 225 | 10 | F |
| Tank 3 | 2024-05-13 08:12:00 | -176.5 | -195.4 | 225 | 10 | F |
Chart MVE TS Event Log Codes
| Event Code | Description |
|---|---|
| AM | Alarm Mute |
| AH | Temp A High Alarm |
| AL | Temp A Low Alarm |
| BB | Running on battery power |
| BH | Temp B High Alarm |
| BL | Temp B Low Alarm |
| BP | Bypass Sensor Open |
| BV | Low Battery Voltage Alarm |
| BY | Hot Gas Bypassing |
| CA | Temp A Calibration Alarm |
| CB | Temp B Calibration Alarm |
| CG | Bypass Sensor Calibration Alarm |
| CL | OFAF Network Communication Loss |
| F | Filling |
| FD | Fill Disabled |
| FT | Fill Time Alarm |
| HG | Hot Gas Bypass Time Alarm |
| LH | High Level Alarm |
| LL | Low Level Alarm |
| LO | Lid Open Alarm |
| PF | Power Failure |
| UW | Liquid Usage Warning Alarm |
| ZO | Level Zeroing |
This document was compiled on Mon Jul 29 20:06:17 2024 using R version 4.4.0 and Tidyverse version 2.0.0. All figures and code are licensed as CC BY 4.0 attributed to Bevan Weir. Source code is available at https://github.com/onco-p53/chart-MVE.